Bowker MA,Belnap J, Chaudhary VB, Johnson NC (2008) Revisiting classic water erosion models in drylands: The strong impact of biological soil crusts. Soil Biology & Biochemistry 40: 2309 - 2316.
DeCoster, JK, Swan, MC (2009) Integrated upland vegetation and soils monitoring for Petrified Forest National Park: 2007 summary report. Natural Resource Data Series NPS/ SCPN/NRDS—2009/005. National Park Service, Fort Collins, Colorado.
Hodgkinson, HS (1987) Relationship of saltbush species to soil chemical properties. Journal of Range Management. 40: 23-26.
Ladenburger,CG,Hilda,AL,Kazmerb,DJ,Munn,LC (2006)Soil salinity patterns in Tamarix invasions in the Bighorn Basin, Wyoming, USA. Journal of Arid Environments 65: 111-128.
Miller, ML (1975) Soil survey of Apache County, Arizona, central part. Washington: U.S. Dept. of Agriculture, Soil Conservation Service.
Shaw, JR, Cooper, TJ (2008) Linkages among watersheds, stream reaches,and riparian vegetation in dryland ephemeral stream networks. Journal of Hydrology 350: 68-82.
Thomas, KA, Hansen, M, Seger, C (2003) Part 1: Vegetation of Petrified Forest National Park, Arizona. US Geological Survey, Southwest Biological Center.
Ungar, IA (1966) Salt tolerance of plants growing in saline areas of Kansas and Oklahoma. Ecology 47: 154-155.
USDA-NRCS (2002) PLANTS database. http://plants.usda.gov.
Thomas, K. A., M. L. McTeague, A. Cully, K. Schulz, and J. M. S. Hutchinson. (2009) Vegetation classification and distribution mapping report: Petrified Forest National Park. National Resource Technical Report NPS/SCPN/NRTR— 2009/273. National Park Service, Fort Collins, Colorado.
Thursday, July 29, 2010
Wednesday, July 28, 2010
Phase 1 question preview
1. Please identify any states or phases which should be omitted from the state-and-transition model. You may select more than one.
2. Please identify any states or phases which are currently not in the model, but should be added to the state and transition model.
[Please briefly list structural properties like dominant species or overall vegetative cover (whatever you feel is important to mention), and functional properties & processes such as fire return intervals, or low soil stability, or whatever may be important. Please indicate any feedback mechanisms which tend to maintain these states.]
3. Please identify any transitions which should be omitted from the state-and-transition model. You may select more than one.
4. Please identify any transitions which are currently not in the model but should be added to the state and transition model.
[For each addition provide, the starting state/phase and ending state/phase for which the transition applies. Identify plausible trigger mechanisms. Also please provide a brief explanation of the process that brings about the transition, e.g. fire, insect outbreak, drought, grazing. Please note the dominant scale of the trigger mechanism, and the importance of temporal convergence and order with other mechanisms (e.g. simultaneous drought and grazing may function as a trigger when either alone do not). Also suggest monitor-able indicators.]
5. Please estimate your overall confidence that a new revised model which takes into account your proposed modifications is the correct model of the most important ecosystem states, processes and dynamics of the ecosite in question.
[Please answer on a subjective scale of 0 – 100% certainty. Enter any value in this range. To help you answer: 0% means “It’s anyone’s guess, this model is no better than any other model”, 50% means “Because this model is reasonable I would tend to believe it until evidence to the contrary is presented”, 100% means “The model is so well-supported by evidence and accumulated knowledge, that I am certain it is correct.”]
6. If your level of confidence in any particular state/phase or transition differs from the value above please estimate your confidence (any value, 0 - 100%) for that model component in the appropriate box. In case you are estimating a confidence in a state or transition suggested by you in questions 2 and 4, please use the “other” options to identify it.
[If you do not provide answers to 6 we will assume they are the same as the answers to 5 in all cases.]
7. Please take a moment to think of any individual, or group of individuals, who is/are to your knowledge the best qualified to develop a state-and-transition model for this ecosite. This could include yourself, or any other persons. “Best” qualified may or may not mean highly qualified; sometimes no one is highly qualified. Now, in the hypothetical scenario that this person, or group of persons, had prepared a state-and-transition model for this ecosite using all of the data, knowledge and experience available to them, estimate how much confidence you would have that it is the correct model of the most important ecosystem states, processes and dynamics of the ecosite in question.
[Please answer on a subjective scale of 0 – 100% certainty. Enter any value in this range. To help you answer: 0% means “It’s anyone’s guess, any person could produce an equally good or bad model”, 50% means “Because this model is reasonable I would tend to believe it until evidence to the contrary is presented”, 100% means “The model is so well-supported by evidence and accumulated knowledge, that I am certain it is correct”.]
8. Use this box for additional comments that do not fit the previous question. Please identify yourself. This will not be viewable by other respondants, but will enable us to know which of the finite qualified respondents have answered so we can acknowledge them. Also if you like, tell us what you like/dislike about this survey and how it could be improved. We are also interested in hearing suggestions of people we should contact who might know this ecosystem.
Sandstone/shale Uplands (Wupatki) - Lit. Cited
Bowker, MA, Belnap, J (2007) Spatial Modeling of Biological Soil Crusts to Support Land Management Decisions: Indicators of Range Health and Conservation–restoration Value Based Upon the Potential Distribution of Biological Soil Crusts in Montezuma Castle, Tuzigoot, Walnut Canyon, and Wupatki National Monuments, Arizona. Unpublished Report.
DeCoster JK, Swan, MC (2009) Integrated upland vegetation and soils monitoring for Wupatki National Monument: 2008 summary report. Natural Resource Data Series NPS/SCPN/NRDS—2009/022. National Park Service, Fort Collins, Colorado.
Hansen M, Coles J, Thomas KA, Cogan K, Reid M, Von Loh J, Schulz K (2004) USGS-NPS National Vegetation Mapping Program: Wupatki National Monument, Arizona, Vegetation Classification and Distribution. U.S Geological Survey, Southwest Biological Science Center.
Ironside K (2006) Climate change research in national parks; paleoecology, policy, and modeling the future. MS Thesis, Northern Arizona University.
Jameson DA (1962) Effects of Burning on a Galleta-Black Grama Range Invaded by Juniper. Ecology 43:760–763.Ironside K (2006) Climate change research in national parks; paleoecology, policy, and modeling the future. MS Thesis, Northern Arizona University.
Sullivan AP, Downum CE (1991) Aridity, activity, and volcanic ash agriculture: a study of short-term prehistoric cultural-ecological dynamics. World Archaeol 22:271–287.
USDA-SCS (1971) Soil survey and range site and condition inventory. Wupatki National Monuments, Arizona: A special report. US Department of Agriculture, Soil Conservation Service, Washington DC
USDA-SCS (1983) Soil survey of Coconino County area, Arizona, Central Part. US Department of Agriculture, Soil Conservation Service, Washington DC
Monday, July 26, 2010
Sandstone/shale Uplands (Wupatki) - Phase 1
(Note to mac users: this page may not display properly, a glitch I haven't solved yet. If it appears "wierd" or poorly formatted, let me know please & we'll arrange another way to do the survey-M)
This post contains a "Phase 1 Survey", which will help finalize a state-and-transition model. If you have not read the background information on this type of model before, please review the post "state-and-transition background". If the link doesn't work, the post is in the archive located to the right of the blog frontpage (it will be found under July 2010).
Please study the following state-and-transition model for Sandstone/Shale Uplands in Wupatki National Monument and surrounding areas, then respond to the survey at the end. We suggest that respondents spend less than 1.5 hours reviewing the information and responding to the survey; additional time is optional but not expected. Respondents may refer to any information source they already know of, but are not expected to conduct an extensive literature review (that is our job). Rather they are expected to answer based upon general principles, past experience, and knowledge of this and similar ecosystems.
Ecological Site Background: See NRCS ecological site description for details and an independently produced draft state-and-transition model. Sandstone/shale uplands are found in the Wupatki Basin and surrounding areas (Fig 1). They have shallow soils overlying exposures of the red Moenkopi sandstone, and to some degree shale members of the Wupatki formation. The soil surface is typically covered to varying degrees by black volcanic cinders. Precipitation ranges from 15 -25 cm (6- 10 inches) per year, and falls in the form of cool season rain & snow, and high intensity summer monsoons. Elevations are around 1500 m (4600 ft.). Currently vegetation is primarily shrublands variously dominated by Atriplex canescens, Artemisia filifolia, Gutierrezia sarothrae, Fallugia paradoxa and Ephedra spp. There is considerable data on the vegetation community composition in the form of percent cover data at 9 points, and categorical vegetation type for 56 accuracy assessment points in a recent USGS vegetation mapping effort. Data on ecosystem functional attributes, ground cover, or spatial attributes of vegetation are confined to only 10 datapoints in the National Park Service Inventory and Monitoring Program. Thus data on the range of community structure are fairly rich, but data on ecosystem function are sparse. Ironside (2006) sampled a few packrat middens from within 100 m of sandstone uplands that provide some information about long-term vegetation change.
Figure 1. Location map showing Wupatki boundary in black, and Sandstone/Shale Uplands in turquoise (click to enlarge).

Draft State-and-transition model
Fig 2. State-and-transition diagram (click to enlarge).

Catalog of States & Phases
We acknowledge a key difference between ecosystems states that existed prior to and during the eruption of Sunset Crater and the subsequent human occupation, and those which are currently possible.
Pre1. Pre-eruption. Vegetation was likely shrub-dominated, with Ephedra viridis and Atriplex canescens being the best represented species in packrat middens in the Wupatki Basin in general (Ironside 2006). In a midden series of the nearby (within a few km) Doney Cliffs area, most grasses were less abundant or absent at this time; though this may reflect changes only in the Doney Cliffs, it is our best window to the past lower in the basin. Soil surface characteristics suggest potential for some minor degree of biological soil crust development (Bowker and Belnap 2007).
Pre2. Post eruption and occupation. State Pre1 experienced two drastic changes which almost certainly led to rapid transitions. First the Sunset Crater eruption deposited up to several centimeters of volcanic ash and cinder possibly killing vegetation. Cinder deposition is thought to have improved water infiltration dynamics, and likely strongly altered hydrology (Sullivan and Downum 1991). Biological soil crust potential, previously low would have been strongly restricted (Bowker and Belnap 2007). Within a few decades an approximately century-long occupation of dry-farming societies ensued. These are thought to have been abandoned due to declining soil nutrient stores (Sullivan and Downum 1991).
S1. Reference Shrublands. After over 500 years of recovery from cinder deposition and impacts associated with occupation by agricultural societies, new vegetation assemblages arose. The reference state consists of multiple spatial variants. These are dictated by local amounts of volcanic cinder accumulation. These phases are depicted without transitions, because land use and management are not likely to impact amount of cinder at a whole site-scale. The expectations of grass dominance across the sandstone/shale uplands in soil surveys and range assessments (USDA-SCS 1971, 1983) is not supported in any hard evidence as grasslands are only occasional (Hansen et al. 2004). Rather, a midden series from nearby indicate that A. canescens and Ephedra have been major community components for at least the last 500 years (Ironside 2006).
S1P1. Cinder communities. These are deep cinder deposits which may be nearly devoid of vegetation (cinder barrens), or may be dominated by the cinder specialist Eriogonum corymbosum. These are likely resistant to change.
S1P2. Apache plume or sand sage communities. These communities occur where cinders deposits are nearly to completely continuous and may be several cm deep. This configuration favors species normally common on pure cinder soils (Fallugia paradoxa), or on sand dunes (Artemisia filifolia). Ephedra spp. (especially), Gutierrezia sarothrae, and Atriplex canescens are also represented.
S1P3. Palatable shrub/grasslands. These communities occur where cinder deposition is shallow or discontinuous. The most abundant species is likely to be the palatable shrub Atriplex canescens, but Ephedra spp. may codominate. Gutierrezia may also be important. These communities are probably the most similar extant analog to Pre1, athough they may contain more grasses. Grass-dominated sites are possible but rare composing only ~ 7% of sandstone/shale uplands within the monument (accuracy assessment data, Hansen et al. 2006; Fig. 5).
S2. Denuded. Introduction of grazing would have reduced overall vegetation cover, and would tend to increase the relative abundance of unpalatable shrubs (e.g. Ephedra, Gutierrezia, and Ericameria nauseosum) over more palatable grasses and shrubs (A. canescens, Pleuraphis jamesii, Bouteloua spp.). Examination of time series photos seems to indicate that vegetation cover in some areas of the Wupatki Basin were markedly denuded around the turn of the 20th century and well into that century (Unknown 1890-1920, Unknown 1936, Muench 1950-1970; Figs 3 & 4). Other historical photos indicate the loss of vegetation in the Wupatki area in general (e.g. Cedar Canyon, Antelope Prairie, Jameson 1962). Invasion by Salsola is possible at this stage and may persist post-recovery (DeCoster and Swann 2009), but no current evidence indicates that it is likely to be dominant or that perennial vegetation is likely to be replaced by annuals (Hansen et al. 2006). As in S1, there are two spatial variants of S2, based solely on the degree of cinder coverage and therefore hydrological properties.
S2P1. Devegetated/minor cinder.
S2P2. Devegetated/major cinder.
Figure 3. Wukoki ruins & vicinity in (from top to bottom) 1905, 1950, and 1970 (click to enlarge any image), showing denudation and subsequent recovery of vegetation. The 1905 image shows a landscape largely devoid of vegetation. The uplands in the background of the 1950 and 1970 images represent sandstone/shale uplands.


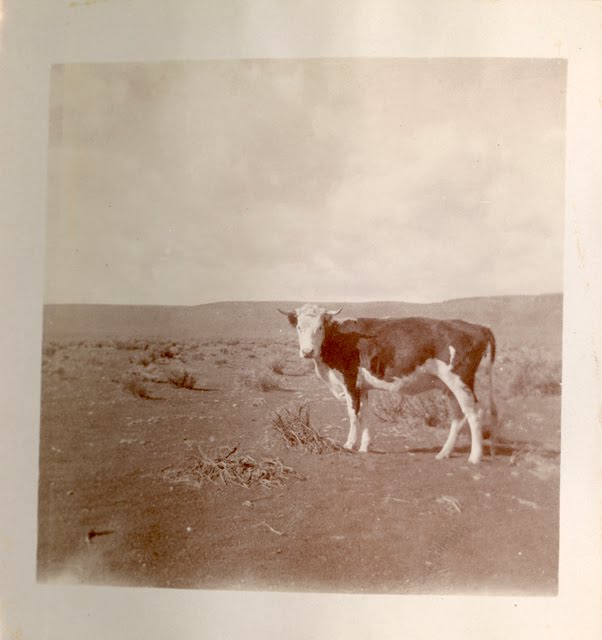
Figure 4. The following photos were taken near Heiser Spring in between 1890 and 1920 on sandstone/shale uplands (exact dates not known). They show at least a localized vegetation loss due to heavy livestock use in that area. Corral to left, in top left photo indicates stock are near to but not within a corral.


S3. Persistently denuded & eroded. This state is largely theoretical, since most previously denuded areas seem to be vegetated today (e.g Wukoki vicinity, Fig.3). It is analogous to the "Severely eroded" state proposed in the NRCS draft model for this ecological site. If denudation and intense grazing pressure were to persist, or if they coincided with an extreme drought, abiotic processes, e.g. erosion, could become dominant. In a quantitative survey, the total cover inside the monument (8 sites) ranges from 17 - 27.5%, but is only 2.5% in the sole plot sampled outside of the monument (Hansen et al. 2006). If such sites were examined for erosional features, evidence for the existence of this state may be found. We would expect to see erosional features such as rills, gullies, terracettes, sheet erosion, and scalding. Water-stable soil aggregation, and index of erosion resistance, is very low in these soils, typically scoring in the lowest two categories using the Herrick soil stability test (Bowker and Belnap 2007). USDA-SCS (1971) also indicates a greater erosion risk with overgrazing, and steeper slopes. Unchecked erosion would not allow re-establishment of vegetation, and the lack of vegetation would increase erosivity and erodibility, perpetuating erosion.
S4. Coppiced. This state is entirely based upon the existence of an Ephedra-Achnatherum hymenoides hummock vegetation type in Hansen et al. (2006) which bears a resemblance to coppiced sand dune ecosystems. This vegetation type occurs only outside of the monument in currently grazed landscapes, whereas communities with A. filifolia or Fallugia paradoxa are much more abundant within the monument boundaries (Fig. 5), suggesting a plausible degradation pathway from S1P2 to S2P2 to S4 (accuracy assessment data, Hansen et al. 2006). Coppice dune ecosystems arise when there is eolian movement of sediment, in this case cinders, within the site. Cinders tend to form micro-dunes surrounding deposition tolerant plants such as Ephedra. Average number of plant patches decreases and size of patches increase. Interspaces between plants emit sediment available for eolian transport.
Figure 5. Proportional abundance of various types of vegetation communities on sandstone/shale uplands inside and outside of Wupatki National Monument (click to enlarge).
Explanation of transitions
T1. Cinder deposition from Sunset Crater eruption deposits cinder mantle of varying thickness, killing depostion intolerant vegetation, and shifting hydrology to favor infiltration.
T2. Dryland farming and other surface disturbances associated human occupation remove native vegetation at the expense of crops, leading to depletion of soil fertility.
T3. High intensity, or sustained year-round cattle or sheep grazing leads to stark reduction in above ground plant abundance. Lower intensity grazing favors unpalatable shrubs over palatable shrubs and grasses. Drought could speed effects.
T4. Long term exclusion of grazing allows recovery of plant cover and relative abundance of palatable species.
T5. High intensity, or sustained year-round cattle or sheep grazing leads to stark reduction in above ground plant abundance. Lower intensity grazing favors unpalatable shrubs over palatable shrubs. Drought could speed effects.
T6. Long term exclusion of grazing allows recovery of plant cover and relative abundance of palatable species.
T7. From a denuded state, high intensity, or sustained year-round cattle or sheep grazing leads to eventual dominance of erosional processes over biotic ones which prevent plant recovery and therefore restabilization of soil.
T8. From a denuded state, continued but relaxed grazing pressure leads to recovery of Ephedra, and a widening of plant spacing. Where wind exposure is sufficient, eolian transport of cinder-derived small gravels and sand occurs within site forming dunes near Ephedra shrubs.
Literature Cited
Survey
When you take the survey you will be unable to save and exit without completing it. Preview questions here. We recommend that you either keep the blog post open in one window, while working on the survey in another, or print essential materials such as figure 2, so that you can refer to them while taking the survey.
Click here to take survey
This post contains a "Phase 1 Survey", which will help finalize a state-and-transition model. If you have not read the background information on this type of model before, please review the post "state-and-transition background". If the link doesn't work, the post is in the archive located to the right of the blog frontpage (it will be found under July 2010).
Please study the following state-and-transition model for Sandstone/Shale Uplands in Wupatki National Monument and surrounding areas, then respond to the survey at the end. We suggest that respondents spend less than 1.5 hours reviewing the information and responding to the survey; additional time is optional but not expected. Respondents may refer to any information source they already know of, but are not expected to conduct an extensive literature review (that is our job). Rather they are expected to answer based upon general principles, past experience, and knowledge of this and similar ecosystems.
Ecological Site Background: See NRCS ecological site description for details and an independently produced draft state-and-transition model. Sandstone/shale uplands are found in the Wupatki Basin and surrounding areas (Fig 1). They have shallow soils overlying exposures of the red Moenkopi sandstone, and to some degree shale members of the Wupatki formation. The soil surface is typically covered to varying degrees by black volcanic cinders. Precipitation ranges from 15 -25 cm (6- 10 inches) per year, and falls in the form of cool season rain & snow, and high intensity summer monsoons. Elevations are around 1500 m (4600 ft.). Currently vegetation is primarily shrublands variously dominated by Atriplex canescens, Artemisia filifolia, Gutierrezia sarothrae, Fallugia paradoxa and Ephedra spp. There is considerable data on the vegetation community composition in the form of percent cover data at 9 points, and categorical vegetation type for 56 accuracy assessment points in a recent USGS vegetation mapping effort. Data on ecosystem functional attributes, ground cover, or spatial attributes of vegetation are confined to only 10 datapoints in the National Park Service Inventory and Monitoring Program. Thus data on the range of community structure are fairly rich, but data on ecosystem function are sparse. Ironside (2006) sampled a few packrat middens from within 100 m of sandstone uplands that provide some information about long-term vegetation change.
Figure 1. Location map showing Wupatki boundary in black, and Sandstone/Shale Uplands in turquoise (click to enlarge).

Draft State-and-transition model
Fig 2. State-and-transition diagram (click to enlarge).

Catalog of States & Phases
We acknowledge a key difference between ecosystems states that existed prior to and during the eruption of Sunset Crater and the subsequent human occupation, and those which are currently possible.
Pre1. Pre-eruption. Vegetation was likely shrub-dominated, with Ephedra viridis and Atriplex canescens being the best represented species in packrat middens in the Wupatki Basin in general (Ironside 2006). In a midden series of the nearby (within a few km) Doney Cliffs area, most grasses were less abundant or absent at this time; though this may reflect changes only in the Doney Cliffs, it is our best window to the past lower in the basin. Soil surface characteristics suggest potential for some minor degree of biological soil crust development (Bowker and Belnap 2007).
Pre2. Post eruption and occupation. State Pre1 experienced two drastic changes which almost certainly led to rapid transitions. First the Sunset Crater eruption deposited up to several centimeters of volcanic ash and cinder possibly killing vegetation. Cinder deposition is thought to have improved water infiltration dynamics, and likely strongly altered hydrology (Sullivan and Downum 1991). Biological soil crust potential, previously low would have been strongly restricted (Bowker and Belnap 2007). Within a few decades an approximately century-long occupation of dry-farming societies ensued. These are thought to have been abandoned due to declining soil nutrient stores (Sullivan and Downum 1991).
S1. Reference Shrublands. After over 500 years of recovery from cinder deposition and impacts associated with occupation by agricultural societies, new vegetation assemblages arose. The reference state consists of multiple spatial variants. These are dictated by local amounts of volcanic cinder accumulation. These phases are depicted without transitions, because land use and management are not likely to impact amount of cinder at a whole site-scale. The expectations of grass dominance across the sandstone/shale uplands in soil surveys and range assessments (USDA-SCS 1971, 1983) is not supported in any hard evidence as grasslands are only occasional (Hansen et al. 2004). Rather, a midden series from nearby indicate that A. canescens and Ephedra have been major community components for at least the last 500 years (Ironside 2006).
S1P1. Cinder communities. These are deep cinder deposits which may be nearly devoid of vegetation (cinder barrens), or may be dominated by the cinder specialist Eriogonum corymbosum. These are likely resistant to change.
S1P2. Apache plume or sand sage communities. These communities occur where cinders deposits are nearly to completely continuous and may be several cm deep. This configuration favors species normally common on pure cinder soils (Fallugia paradoxa), or on sand dunes (Artemisia filifolia). Ephedra spp. (especially), Gutierrezia sarothrae, and Atriplex canescens are also represented.
S1P3. Palatable shrub/grasslands. These communities occur where cinder deposition is shallow or discontinuous. The most abundant species is likely to be the palatable shrub Atriplex canescens, but Ephedra spp. may codominate. Gutierrezia may also be important. These communities are probably the most similar extant analog to Pre1, athough they may contain more grasses. Grass-dominated sites are possible but rare composing only ~ 7% of sandstone/shale uplands within the monument (accuracy assessment data, Hansen et al. 2006; Fig. 5).
S2. Denuded. Introduction of grazing would have reduced overall vegetation cover, and would tend to increase the relative abundance of unpalatable shrubs (e.g. Ephedra, Gutierrezia, and Ericameria nauseosum) over more palatable grasses and shrubs (A. canescens, Pleuraphis jamesii, Bouteloua spp.). Examination of time series photos seems to indicate that vegetation cover in some areas of the Wupatki Basin were markedly denuded around the turn of the 20th century and well into that century (Unknown 1890-1920, Unknown 1936, Muench 1950-1970; Figs 3 & 4). Other historical photos indicate the loss of vegetation in the Wupatki area in general (e.g. Cedar Canyon, Antelope Prairie, Jameson 1962). Invasion by Salsola is possible at this stage and may persist post-recovery (DeCoster and Swann 2009), but no current evidence indicates that it is likely to be dominant or that perennial vegetation is likely to be replaced by annuals (Hansen et al. 2006). As in S1, there are two spatial variants of S2, based solely on the degree of cinder coverage and therefore hydrological properties.
S2P1. Devegetated/minor cinder.
S2P2. Devegetated/major cinder.
Figure 3. Wukoki ruins & vicinity in (from top to bottom) 1905, 1950, and 1970 (click to enlarge any image), showing denudation and subsequent recovery of vegetation. The 1905 image shows a landscape largely devoid of vegetation. The uplands in the background of the 1950 and 1970 images represent sandstone/shale uplands.


Figure 4. The following photos were taken near Heiser Spring in between 1890 and 1920 on sandstone/shale uplands (exact dates not known). They show at least a localized vegetation loss due to heavy livestock use in that area. Corral to left, in top left photo indicates stock are near to but not within a corral.


S3. Persistently denuded & eroded. This state is largely theoretical, since most previously denuded areas seem to be vegetated today (e.g Wukoki vicinity, Fig.3). It is analogous to the "Severely eroded" state proposed in the NRCS draft model for this ecological site. If denudation and intense grazing pressure were to persist, or if they coincided with an extreme drought, abiotic processes, e.g. erosion, could become dominant. In a quantitative survey, the total cover inside the monument (8 sites) ranges from 17 - 27.5%, but is only 2.5% in the sole plot sampled outside of the monument (Hansen et al. 2006). If such sites were examined for erosional features, evidence for the existence of this state may be found. We would expect to see erosional features such as rills, gullies, terracettes, sheet erosion, and scalding. Water-stable soil aggregation, and index of erosion resistance, is very low in these soils, typically scoring in the lowest two categories using the Herrick soil stability test (Bowker and Belnap 2007). USDA-SCS (1971) also indicates a greater erosion risk with overgrazing, and steeper slopes. Unchecked erosion would not allow re-establishment of vegetation, and the lack of vegetation would increase erosivity and erodibility, perpetuating erosion.
S4. Coppiced. This state is entirely based upon the existence of an Ephedra-Achnatherum hymenoides hummock vegetation type in Hansen et al. (2006) which bears a resemblance to coppiced sand dune ecosystems. This vegetation type occurs only outside of the monument in currently grazed landscapes, whereas communities with A. filifolia or Fallugia paradoxa are much more abundant within the monument boundaries (Fig. 5), suggesting a plausible degradation pathway from S1P2 to S2P2 to S4 (accuracy assessment data, Hansen et al. 2006). Coppice dune ecosystems arise when there is eolian movement of sediment, in this case cinders, within the site. Cinders tend to form micro-dunes surrounding deposition tolerant plants such as Ephedra. Average number of plant patches decreases and size of patches increase. Interspaces between plants emit sediment available for eolian transport.
Figure 5. Proportional abundance of various types of vegetation communities on sandstone/shale uplands inside and outside of Wupatki National Monument (click to enlarge).

Explanation of transitions
T1. Cinder deposition from Sunset Crater eruption deposits cinder mantle of varying thickness, killing depostion intolerant vegetation, and shifting hydrology to favor infiltration.
T2. Dryland farming and other surface disturbances associated human occupation remove native vegetation at the expense of crops, leading to depletion of soil fertility.
T3. High intensity, or sustained year-round cattle or sheep grazing leads to stark reduction in above ground plant abundance. Lower intensity grazing favors unpalatable shrubs over palatable shrubs and grasses. Drought could speed effects.
T4. Long term exclusion of grazing allows recovery of plant cover and relative abundance of palatable species.
T5. High intensity, or sustained year-round cattle or sheep grazing leads to stark reduction in above ground plant abundance. Lower intensity grazing favors unpalatable shrubs over palatable shrubs. Drought could speed effects.
T6. Long term exclusion of grazing allows recovery of plant cover and relative abundance of palatable species.
T7. From a denuded state, high intensity, or sustained year-round cattle or sheep grazing leads to eventual dominance of erosional processes over biotic ones which prevent plant recovery and therefore restabilization of soil.
T8. From a denuded state, continued but relaxed grazing pressure leads to recovery of Ephedra, and a widening of plant spacing. Where wind exposure is sufficient, eolian transport of cinder-derived small gravels and sand occurs within site forming dunes near Ephedra shrubs.
Literature Cited
Survey
When you take the survey you will be unable to save and exit without completing it. Preview questions here. We recommend that you either keep the blog post open in one window, while working on the survey in another, or print essential materials such as figure 2, so that you can refer to them while taking the survey.
Click here to take survey
State-and-transition background (Optional)
BACKGROUND
State-and-transition models are an increasingly common conceptual method of organizing knowledge of successional dynamics in ecosystems. Unlike older successional theories they allow for multiple successional pathways, do not assume a single “climax” and do not assume that successional change is reversible. They assume that a given ecosystem might be capable of shifting among multiple stable states, when a specific “trigger” leads to a transition. The model seeks to identify the primary stable states, and key phases within those states, and the transitions among them. States and phases are defined by structural properties such as dominant plants and other biota or biodiversity, and functional properties/processes such as frequent fire return intervals or high soil aggregate stability. The properties of states and phases may be dynamic (e.g. plant cover & community composition) or inherent (e.g. climate, soil properties, landscape physiography), and may confer resistance (the ability to maintain the same set of structural/functional properties, i.e. not change) or resilience (the ability to experience change but return to the original set of structural/functional properties) to ecosystem change. Phases within states are different varieties of a state, and transitions from one phase to another tend to be fairly common, easily triggered, and often reversible. Phases may also be spatial variants of a state, dictated by inherent factors. There are particular phases which are at-risk to transition to degraded states, due to their structural or functional properties. Dynamics within a state, i.e. shifts from phase to phase, tend to be characterized by negative feedbacks which confer resilience. In contrast, transitions among stable states, may be abrupt, may exhibit threshold behaviors. Every transition has an underlying trigger, or combination of triggers, for example introduction of grazing. The trigger initiates a change in structural or functional properties of the ecosystem (e.g. loss of vegetative cover, and disruption of soil surface aggregates), which may engage new processes which bring about a transition to a new state. These transitions may be monitored with indicators.
If you would like more background on the current state-and-transition modeling framework we suggest reading:
Briske et al. 2008. Rangeland Ecology & Management 61:359–367.
Bestelmeyer et al. 2009. Rangeland Ecology & Management 62:1-15.
Subscribe to:
Comments (Atom)